The goal
Marketing reports usually stop at leads and bookings. I wanted a pipeline where I could follow a dollar of ad spend all the way to an appointment that actually happened, and where every number on the dashboard could be traced back and checked. Not a clever model; a pipeline I could trust.
The data is synthetic, and I say so on every page, because the interesting part was never the numbers. It was building the plumbing and finding where it breaks. I worked with an AI assistant (Claude) to design and draft code and documents. I ran every command, read every output, and made the scope decisions. The mistakes below are mine.
Step 1: a funnel I could repeat
I generated six months of spend, leads, bookings and appointments for five channels with a fixed random seed, so my numbers matched the ones I was expecting on the first run. The key modeling choice: a booking is not an appointment. Some bookings are cancelled or become no-shows, and appointments scheduled after the last day are still “scheduled”, not yet “occurred”. Everything later depends on that difference.
Incident 1: three failing tests
I saved the SQL views and the tests, pushed, ran pytest and got 13 passes and 3 failures, all with the same message: the view did not exist. Nothing was wrong with the code. I had never run the script that creates the views, and nothing in my notes said it was a step. Lesson: an unwritten dependency between steps is a bug. From then on every step had its command written out.
Step 2: the spend fan-out trap
Joining spend straight onto leads repeats each spend row once for every lead, so cost inflates silently. I aggregate spend and funnel counts separately and join the totals. Then I added a test that compares the view's total spend to the source table, because the failure produces plausible-looking numbers and no error.
Step 3: the intake API and the workflow
n8n receives the lead, cleans it, and calls a small Flask API that validates and writes. I split it that way because n8n has no SQLite node, and because validation I care about should live in code with tests. The API accepts only four fields. Anything else, such as an email address, is rejected with the field names (never the values) rather than dropped silently.
Three small surprises taught me the tool. n8n's test URL listens for exactly one call, so my second test returned “not registered”. A test lead with the wrong fields showed me how the clean-up node reports what it dropped. And my rejected-lead record included an extra field that the API correctly refused, which was the allowlist working on my own mistake.
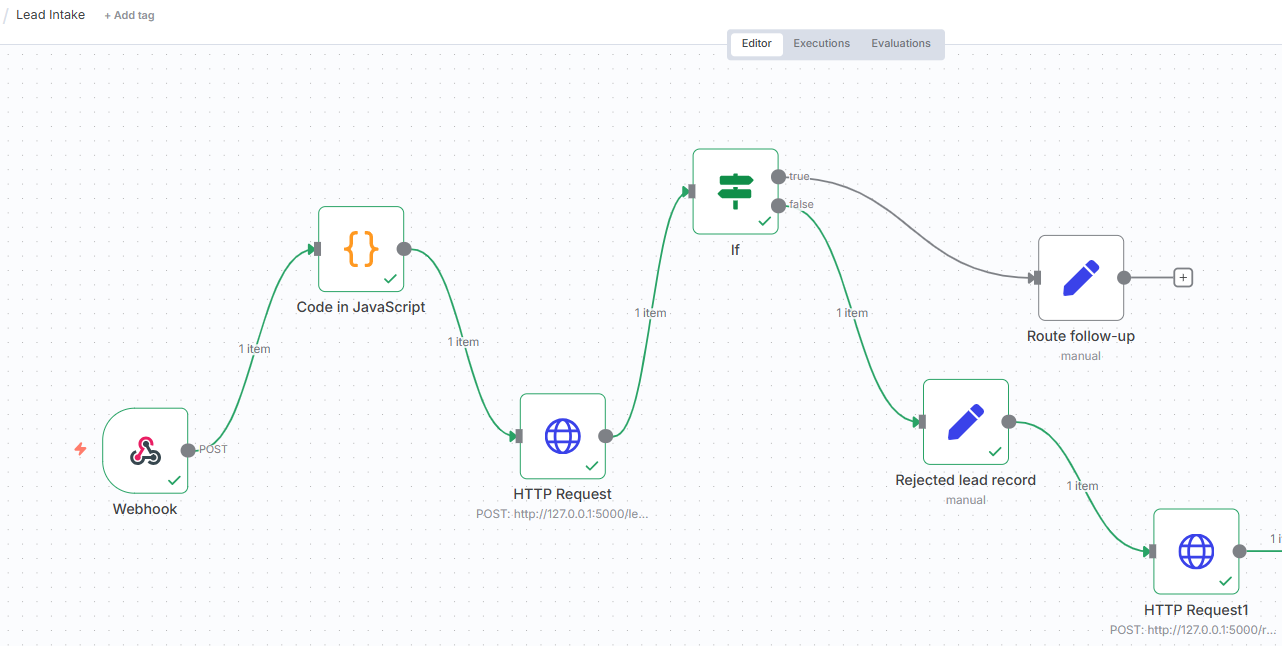
The n8n intake workflow: receive, clean, call the API, then route success or rejection.
Incident 2: the lead I lost
The API was not running when I sent a test lead. n8n showed a connection-refused error and the lead was gone: it existed only in n8n's execution history. I had switched on “Never Error” so that a 422 could flow to a rejected branch, and that setting only helps when the API answers.
Thinking it through, I found three weaknesses, not one:
- No answer is not an error response. When the API is down there is nothing to route.
- A validation failure and an outage look identical. My IF node treats anything but 201 as one path, so a 500 (retry would help) is logged like a 422 (retry would not).
- The rejected-lead log depends on the same API. If the API is down, recording the failure fails too.
I then tested n8n's Retry On Fail with the API stopped. No retries were observed and the lead was still lost. I recorded what I saw and wrote the engineering spec instead of pretending I had a fix. The design in that spec needs a durable inbox, classified retries and an alert, and retries are only safe once duplicate leads are prevented, which is a second spec.
Step 4: a reporting copy, because Metabase would not read SQLite
I wanted Metabase to read my SQLite file directly. My research did not turn up official support for SQLite, so I did not build on it. Instead the API keeps writing to SQLite and a script copies the data to PostgreSQL in Docker, checking that row counts and total spend match before it commits. That is also how many real teams separate operational and reporting databases.
Two small blockers slowed me down. Metabase refused the database login even with the right password; my best guess is browser autofill replacing the typed login, and I fixed it by setting a known password and using a private window. And the chart builder showed an empty Y-axis until I rebuilt the same chart from a SQL question.
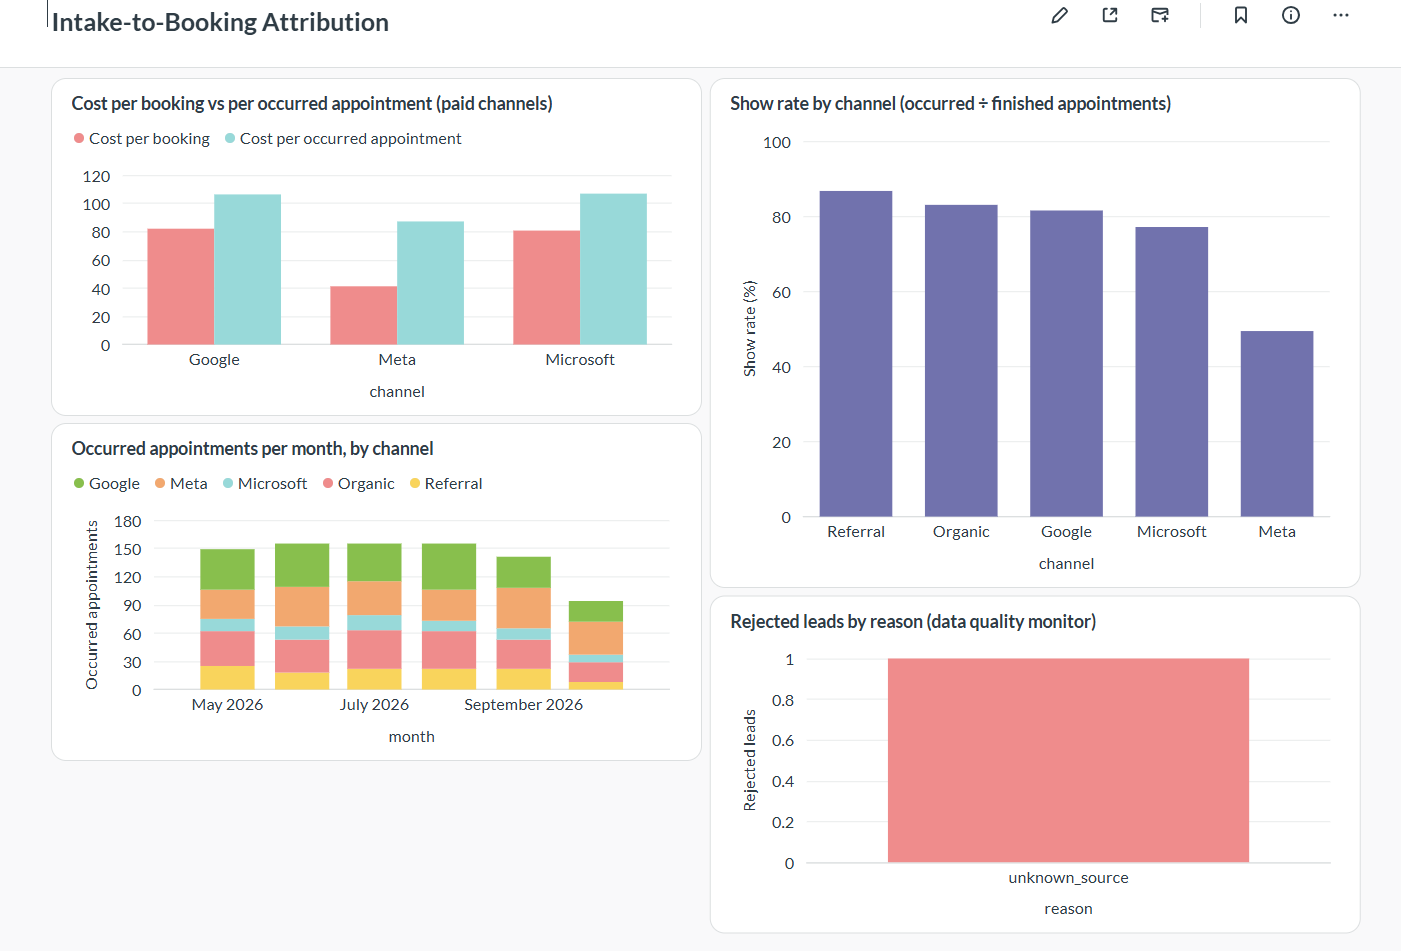
The four-chart dashboard, built on the Postgres reporting copy. All data is synthetic.
Step 5: an assistant that quotes instead of writing
For the staff knowledge assistant I chose not to generate text. It finds the closest passage in a set of fictional approved policies and returns it word for word, with the document ID and effective date. The rules run in a fixed order in plain code: emergency wording first, then patient identifiers, then clinical questions, then a search that abstains when the evidence is weak. A superseded policy is never searched, and a policy dated in the future is not used yet.
Two findings from my own testing. First, my question “How much notice is needed to cancel?” got no answer, because the policy said “24 hours before” and never used the word “notice”. I rewrote the policy in the words staff would use. Second, while testing I found a tension I have not fixed yet: the privacy rule refuses a numeric case ID, but the privacy policy tells staff to use case IDs. The checker cannot tell a case number from a member ID. The fix is a defined case-ID format, and it is on my list.
The 50 tests for this assistant were written by me, so they show the guardrails fire as designed. They say nothing about accuracy on real questions, and the case study says so.
Step 6: a report where the model writes words and code owns the numbers
I wanted a weekly plain-language summary of the funnel written by a language model, without trusting the model with a single number. The model gets named placeholders such as {total.spend} and writes the sentences around them. Code computes every figure from the database, fills the placeholders in, and rejects any text that breaks the rules: a digit outside a placeholder, an unknown placeholder, causal wording, a ranking or direction word without the matching placeholder. Three rejected tries fall back to a fixed template, and an unverified summary is never published.
The first live run passed my checks, and I read the sentences anyway. It called two channels “the largest contributors”, a ranking word my checker did not know. After I fixed that, the next run named one channel as having the highest show rate when two were tied at 67%, because I had decided ties on unrounded values. The run after that wrote “decreasing by within 2%”: its own direction word next to my number, for a channel that was flat. Each time I fixed the checker (more words, ties decided on the displayed value, no direction words written by the model, a channel name must match the data in its sentence) and added a test for the exact sentence that slipped through.
Then the measurement. After the checker was tightened, only 3 of 10 summaries passed on the first try: a prompt rule telling the model not to write direction words was not enough. Adding one worked example to the prompt raised that to 7 of 10, and a separate run of 5 complete reports (up to three attempts each) passed on the first attempt all 5 times. These are small samples on one local model, so I report them as measurements, not guarantees. The checks guarantee the numbers and guard the wording; they cannot prove a sentence is a fair reading of the numbers.
An API endpoint serves the report and an n8n workflow schedules it weekly. It builds the report but does not send it anywhere yet, and it runs only while my machine, n8n and the API are on.
What the dashboard says, and what it does not
Meta looks cheapest per booking, but only about half of its booked visits happen, so the gap narrows per occurred appointment. I chose those rates when building the data. October looks low because appointments after 31 October are still “scheduled” rather than “occurred”, which is not a real decline. I wrote that into the documentation because a reader will ask.
What I would tell myself at the start
- Write the command for every step, including the ones that feel obvious.
- Test what happens when a dependency is down on the first day, not the last.
- Record what you observed, not what you expected. My expectation about retries was wrong, and writing the real result down was worth more than the guess.
- Read the model's actual output, not just whether it passed. My checker approved wrong sentences that my tests had missed.
- Say what is simulated, what is designed but not built, and what is built.
The case study is in Case Study: Intake-to-Booking, and the code, tests, backlog and four engineering specs are in the GitHub repository.